20141024 – Filtering NTP
The hard part of NTP is actually not, as many people seem to think, the PLL, but rather the filtering of the incoming phase error samples.
In difference from most other PLL or PI regulation loops the inputs to a NTP PLL are horrible.
For one thing, they may not even be there.
With a non-trivial probability, clients get no response from NTP servers or if it does, the packet must be discarded because it has been delayed so long that it no longer tell us anything relevant about the clock relationship between the client and the server.
When they arrive, they suffer from a number of not at all gaussian error mechanisms, which no run-of-the-mill filter types handle particularly well, in particular not given that we would really like a constant delay through the filter, in order for the PLL to remain stable.
I have collected a large number of NTP packet exchanges in order to go over all the old wisdom on NTP filtering, and as I expected, it’s not your granddads internet any more.
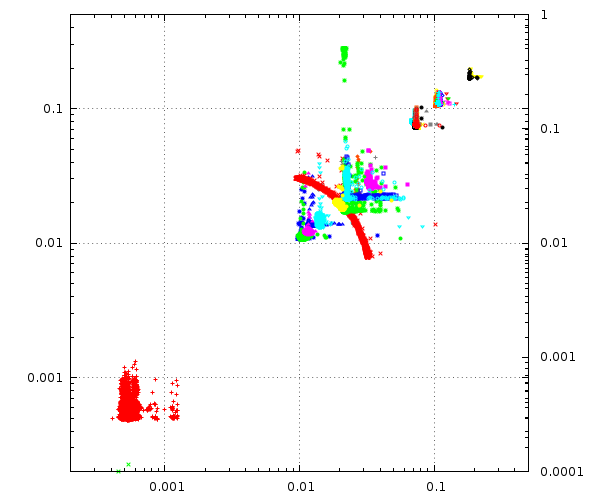
The most interesting way to visualize these data is also a quite pretty way:

First, notice that the axes are logarithmic and scale from 200µs to 0.5s, they span a range of 1:2500.
Each distinct signature are the packets to/from a particular NTP server, plotted with the time from my lab machine to the server on the X axis and the return trip on the Y axis.
The red blob in the low left corner is a stratum two server in my lab, packet travel times is around half a millisecond both ways.
The rest of the blobs are packets to and from from some particular public NTP server, the futher up and right, the longer time the packets took to cross the Internet.
I deliberately included three NTP servers from New Zealand in the sample, since that is about as far from Denmark as you can get, both geographically and RTT wise.
Ohh, and notice that red arc there ? That’s a pretty shit stratum 2 server somewhere in Germany, it drifts a couple all over the place in my dataset. As if the packet-transit noise wasn’t bad enough our filters should try to spot and blacklist such servers.
The really interesting thing is that even though they may be 100ms away from my lab, these servers provide quite good timeservice.
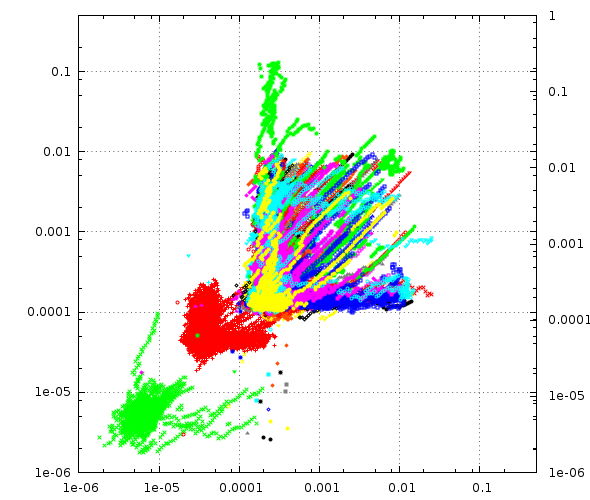
In this plot a running estimate of the standard-deviation of the packet transit time is plotted for the same dataset:

Notice the change of scale, now from [1us to .5s]
You will notice the precense of a green blob below the red one, if you look really carefully in the first plot, you can see to green crosses there also: This is my labs stratum=1 server.
This plot makes the important feature of NTP phase offset measurements very obvious: Notice how almost all these different blobs have the general shape of a blob near X=Y and a tail up and another tail right.
This is because the probability of a packet getting delayed on the way to the server is quite independent of the packet going back being delayed. Not totally independent, but quite independent.
Due to the way we calculate the phase offset, packets on the two tails represent half the delay one of the two packets suffered as phase error and that’s bad for our PLL.
If the packet were delayed equally in both directions, it would be fine and cancel out, but only delayed in one direction is bad.
Not Your Grandfathers ARPANET
NTP is as old The Blues Brothers (“We have both kinds of protocols, IPv4 and IPv6”), older than Das Boot and Raiders of the Lost Ark, so old in fact that people still thought X.25 was a cool protocol and that 56 kbit/sec was “high speed communications”.
At least two things of relevance for NTP have changed since then: Network congestion has dropped and computer clocks have become much more stable.
The reduced congestion increases the probability that packets don’t encounter delays, in particular it reduces the chances that it happens both directions.
The higher stability was necessary in order to make it feasible to multiply a pedestrian 14.318 MHz quartz-crystals output frequency to near 4GHz and use it to clock a billion transistor CPU chip.
And both things are to our advantage: Even using a NTP server in New Zealand, it should be possible for me to synchronize my machine here in Denmark into the low milliseconds, and do it in a matter of minutes.
Filter design
We do not have a theoretical model of how packets traverse the Internet which can inform our filter design, we have to rely on collected real-life data, hoping it is representative, extrapolate with caution and allow plenty of margin for the unexpected.
On the other hand, we don’t have to do it on a PDP/11 computer without hardware floating point instructions, and we can burn 1000 times as many instructions today, and still not use as much CPU power as updating the cursor on the screen does.
The filters I am currently playing with are not median filters like NTPD, median filters suffer from variable delay and I would really like to avoid that.
I maintain a running estimate of the average and standard deviation of the packet transit times in both directions and in total.
If a packet comes back and the RTT is inside 2.5 standard deviations (for some value of 2.5) we take it and run with it. That doesn’t work half shabby at all.
But we can actually salvage many of the packets lost to this filter, because they were only hit in one direction, and the other direction almost always provides credible time information on its own. Obviously, this doesn’t work for the first packet, since we have no way to tell that one or the other direction was out of character, but after as little as four packet exchanges, this kicks in.
phk
